XLNT Platform: Driving A/B Testing at LinkedIn
August 22, 2014
A/B testing is an indispensable driver behind LinkedIn’s data culture. We run more than 200 experiments in parallel daily and that number is growing quickly. We realized early on that ad hoc testing would only take us so far. We needed to change our approach to allow us to quickly quantify the impact of any A/B test in a scientific and controlled manner across LinkedIn.com and our apps.
All of the A/B tests we conduct have a clear end goal of improving our products for the benefit of our members. Like most Internet-based companies, we run experiments that range from small UI tweaks to backend relevance algorithm changes to full redesigns of our homepage. We also have very clear guidelines about what we will not test, which include experiments that are intended to deliver a negative member experience, have a goal of altering members’ moods or emotions, or override existing members’ settings or choices.
To take our A/B testing to the next level, we built XLNT, an internal end-to-end A/B testing platform. XLNT allows for easy design and deployment of experiments, but it also provides automatic analysis that is crucial in popularizing A/B tests. The platform is generic and extensible, covering almost all domains including mobile and email. This month, XLNT turns one year old and hits a major milestone: more than 2,800 experiments have run on it.
XLNT is a key component of LinkedIn’s Continuous Deployment infrastructure. It allows us to ramp A/B tests totally independently from code releases and can be easily managed through a centralized configuration UI. It also lets us isolate the real impact of the experiment from the noise.
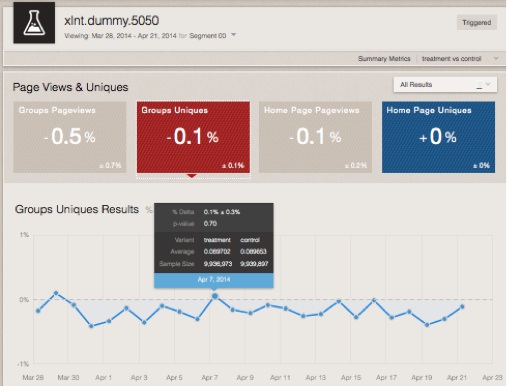
The XLNT platform automatically generates analysis reports, including both the percentage delta and the statistical significance information on many metrics, on a daily basis for every A/B test run across LinkedIn.

We continue to build new features into XLNT to enable everyone at LinkedIn to embed A/B testing in their product development and decision-making process. We recognize that not only are our products diverse, each one of our members is special and unique. With that in mind, many of our experiments focus on how we can provide the most improved member experience possible to specific member segments.
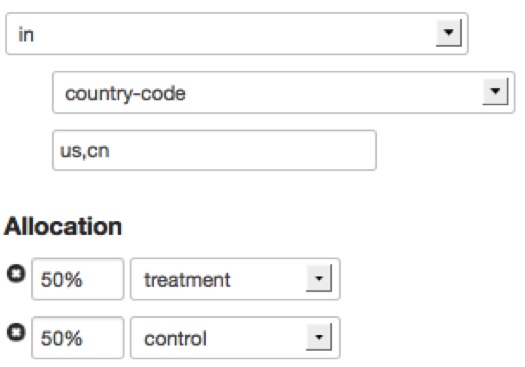
Now XLNT not only makes such customization simple, but also automatically focuses analysis to isolate the real impact from the noise. In addition, to get accurate assessment of the overall impact of an experiment that is comparable across different experiments with different trigger conditions, XLNT also provides a “site wide impact” estimate to measure how the numbers would move if an experiment were to be launched to 100% of our members.
To keep A/B testing scalable as LinkedIn grows, XLNT now lets each team own the logic of their metrics while the experimentation team reviews the metrics definitions, manages the metrics onboarding process and operates daily computations.
We’ve made many changes to our products and launched new features after putting them through A/B tests on the XLNT platform. These changes have measurably improved the member experience on LinkedIn.
Recently, we ran an A/B test on the small module on members profile pages that guides them to complete their profile. This test focused on the impact of adding the value statement, for example, adding the sentence "Add more color to your professional identity by showing what you care about" with a goal of helping our members understand why they should complete their volunteer experience. This small change turned out to be extremely successful. The A/B test showed a 14% increase in edits of volunteer experience in member profiles! The XLNT platform makes it feasible to quickly test such small changes at low cost to the team, so we can continue to identify features with high Return-On-Investment (ROI) and moreover, quantify the impact in a scientific and controlled manner.

XLNT also makes it extremely easy to test ways we can improve the member experience for customized groups of professionals. Clearly, a job recommendation that works for a CEO is very different from one that works for students. Even for the same member, the need is different when visiting from their computer than from their smartphone. XLNT keeps many targeting attributes in a Voldemort store to query real time for any experiments and, in addition, XLNT is able to process any other attributes that are passed along in the request, e.g. browser, device etc.

The deployment in the application code is as simple as one line. For example, to determine the right color to show to a member in a “buttonColor” experiment, we just need to make one call to the client as shown below.
String color = client.getTreatment(memberID, "buttonColor").
Setting up a Multi-variate Test (MVT) simply means creating one call per factor, and the XLNT infrastructure fully supports either full or fractional factorial designs. To enable follow-on analysis, an event is logged during the “getTreatment” call. Logging only when the code is called not only reduces the logs footprint, but also allows us to do triggered analysis where we focus only on users who are actually affected by the experiment.
Automated analytics not only saves teams from time-consuming, ad hoc analysis, but also ensures that the methodology behind the reports is solid, consistent and scientifically founded. To paint with a broad brush, the XLNT analytics pipeline runs in Hadoop to compute member engagement metrics such as page-views and clicks, and joins them with the experiment assignment information we collect from online logging. This data is then aggregated to produce summary statistics that are sufficient to compute the impact on any metrics and the statistical significance information such as p-values and confidence intervals. In addition, to provide more insights into why a metric is moved, XLNT supports multiple-level drill down into various member and product segments. The drill-down feature is customized for different product areas to keep the data from exploding and save us from crunching unnecessary data that no one looks at.
When we launched XLNT a year ago the platform only supported about 50 tests per day. Today, that number has increased to more than 200 tests. The number of metrics supported has also grown from 60 to more than 700. The XLNT platform now crunches billions of experiment events daily to produce more than 30 million summary records. The team that built and now supports XLNT has a clear mission of enabling “accurate decisions made faster @ scale” and continues to strive to ensure that the best innovations are delivered to our members.